Vector Display Introduction
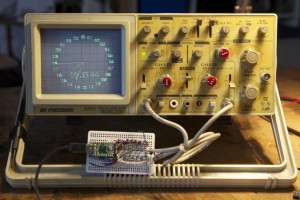
Vector displays are now mostly historical oddities — old arcade games like Asteroids or Tempest, or ancient FAA radar displays — which gives them a certain charm. Unlike modern raster displays, the electron beam in the CRT is not swept left to right and top to bottom for each row in the image. Instead the beam is steered to a point and traces the lines of the displayed image.
Most dual channel oscilloscopes have an XY mode in which the timebase is replaced by the second channel, so instead of a constant sweep frequency the two inputs to be plotted relative to each other. Generating low frequency analog voltages out of a small microcontroller with PWM through a low pass filter is quite common for adjusting the brightness of an LEd, but drawing complex shapes requires a faster way to change the voltage. One very easy way to do this is with an R-2R ladder DAC.
Read on for more details about how to build your own vector display hardware and some ways to draw shapes on your oscilloscope’s screen.
R-2R DAC
The 8-bit R-2R DAC is easy to build and only requires sixteen resistors per channel. 1% are best for linear outputs, but it works fine with common 5% that you might have in your junk box. You will need 7 with some value R, and 9 with twice that value. I used 500 Ohm for the R and 1 KOhm for the 2R from Radio Shack’s variety pack of metal film 1% resistors. Wikipedia has a helpful schematic:
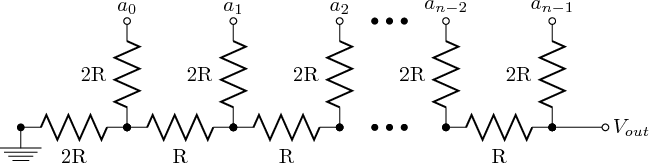
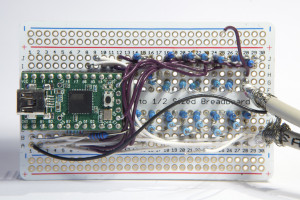
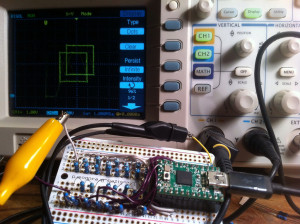
Since we’re driving both the X and Y channels on the scope, we’ll need two DACs. If you don’t want to wire up a bunch of parts, you might be able to find a R-2R resistor network in a SIP package, or you can also use something like the MC1408/1508 multiplying DAC in a 16-DIP. The two DACs fit nicely on Perma-Proto 1/2 size board along with a Teensy 2.0. Whatever MCU you use, you’ll want to have two complete 8-bit ports to be able to update all eight outputs simultaneously. The teensy 2.0 barely makes it — PORTD and PORTB both have eight output pins available, but none of the other ports are fully exposed.
Scope setup
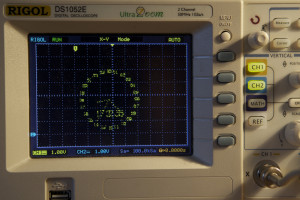
Once you have the pins wired up, connect it to the scope and put it into X-Y mode. For the inexpensive Rigol scopes, press Horizontal Menu - Time Base - X-Y. Unfortunately the entry-level digital LCD scopes are quite poor for vector art compared to the analog CRT scopes, although some high end ones have a “digital phosphorus” mode that simulates the persistence and fading. Luckily old analog CRT scopes are available for almost nothing from ebay or craiglists since everyone is upgrading to the much easier to use and significantly smaller digital scopes.
If you’re driving the outputs directly into the scope instead of using probes, you’ll want DC coupling enabled as well.
Horizontal and vertical lines
Since the DACs are wired directly to an entire AVR port, an analog voltage can be generated by simply writing a value to the port. For example, to generate an output of 2 volts the value of 256 * 2.0V / 5.0V == 102 to that port:
DDRB = 0xFF;
PORTB = 102;
For what we’re doing, we don’t actually care about the output voltage, just that it is roughly linear from 0 V at 0x00 to about Vcc = 5 V at 0xFF. The oscilloscope display can be adjusted in scale and position so that the 0-5 V range on each axis fills the screen.
The first thing to try are horizontal and vertical lines. These are easy to generate with for() loops that hold the X value constant and vary the Y, or vice versa:
void
line_vert(
        uint8_t x0,
        uint8_t y0,
        uint8_t w
)
{
        PORTB = x0;
        PORTD = y0;

        for (uint8_t i = 0 ; i < w ; i++)
                PORTD++;
}

void
line_horiz(
        uint8_t x0,
        uint8_t y0,
        uint8_t h
)
{
        PORTB = x0;
        PORTD = y0;

        for (uint8_t i = 0 ; i < h ; i++)
                PORTB++;
}
To draw a box like the ones shown above require four lines:
    line_vert(64, 64, 128);
    line_vert(196, 64, 128);
    line_horiz(64, 64, 128);
    line_horiz(64, 196, 128);
Diagonal lines
This image shows a very common artifact of vector displays: the bright dots at the beginning and ends of lines. Since the intensity is dependent on the time that the beam remains in that spot, i.e. the time that PORTD and PORTB have constant values, and the program takes a few instructions at the end of each line to fetch the coordinates of the next line... Optimizing this line drawing routine so that it avoids 16-bit math and perhaps adding NOP on the various paths so that they always take the same time would help eliminate the spots.
This is also a good time to mention burn-in on the CRTs. If the values do not change for a long time, that one phosphorus spot can become noticeably different from the others. The screens can even be damaged if the values are changing, drawing the same image over and over. While programming the Teensy the X and Y ports will be tri-stated, leading to 0 volts output on both axes and a very bright spot on the display. It is best to turn the intensity down while re-flashing so that it doesn't burn in the bottom left corner.
Drawing diagonal lines is more difficult than the pure horizontal or vertical ones. Ideally with a vector display the lines and circles would be generated with an analog process that would result in smooth changes in voltage (like the beautiful SC200), but this would require far more analog circuitry than a handful of resistors. Instead we can use Bresenham's Algorithm to generate the points along the line. This results in the "jaggies" in the above image, but is easy to code in C.
void
line(
        uint8_t x0,
        uint8_t y0,
        uint8_t x1,
        uint8_t y1
)
{
        int dx, dy, sx, sy;

        if (x0 < x1)
        {
                dx = x1 - x0;
                sx = 1;
        } else {
                dx = x0 - x1;
                sx = -1;
        }

        if (y0 < y1)
        {
                dy = y1 - y0;
                sy = 1;
        } else {
                dy = y0 - y1;
                sy = -1;
        }

        int err = dx - dy;

        while (1)
        {
                PORTB = x0;
                PORTD = y0;

                if (x0 == x1 && y0 == y1)
                        break;

                int e2 = 2 * err;
                if (e2 > -dy)
                {
                        err = err - dy;
                        x0 += sx;
                }
                if (e2 < dx)
                {
                        err = err + dx;
                        y0 += sy;
                }
        }
}
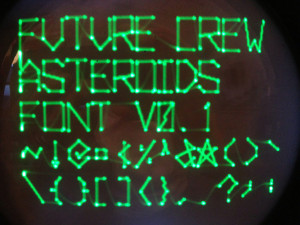
Fonts
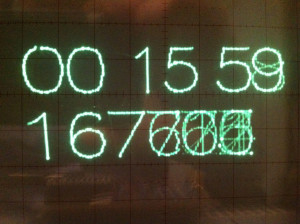
Now that we can draw lines, we want to draw characters, too. The Hershey Fonts are simple enough to use inside the AVR. Each character has no more than 32 points, which is manageable on the small CPUs. The paths are all relative to the origin (lower left) of the character, and are connected, unless the value is (-1,1), in which case it should jump to the next point. The path for the character is terminated with a relative value of (0,0). Here's a data structure for the number 1:
typedef struct {
  int8_t x, y;
} path_t;

static const PROGMEM path_t digits[][32] = {
        [1] = {
                { 6,17},
                { 8,18},
                {11,21},
                {11, 0},
        },
};
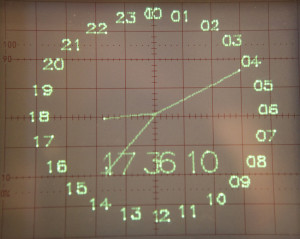
In the above image you can also see the "retrace" as the beam moves from the last point of the "0" to the first point on the "1", and then from the bottom of the "1" to the "5" and so on. This is caused by the voltage at the R-2R output not changing instantaneously; one way to avoid this is to use a Z axis input on the oscilloscope to turn off the beam during these periods, although the scope that I'm using doesn't have this function.
Raster images
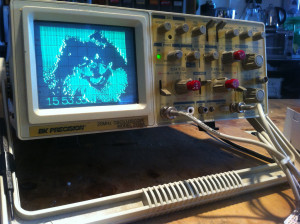
The oscilloscope can also be driven in a raster mode to draw images a point at a time. The image here is encoded into the firmware file as a X Bitmap using ImageMagick, which allows it to be included into the C program:
convert -resize 256x256 input.jpg image/image.xbm
The resulting 256x256x1 image will use 8 KB of program space. It will need to be edited to add the PROGMEM directive on the image_bits declaration so that it will remain in flash, rather than being copied to SRAM during the AVR startup. It is possible to mix vector and raster images with this technique, as you can see from the time display in the bottom left.
Video
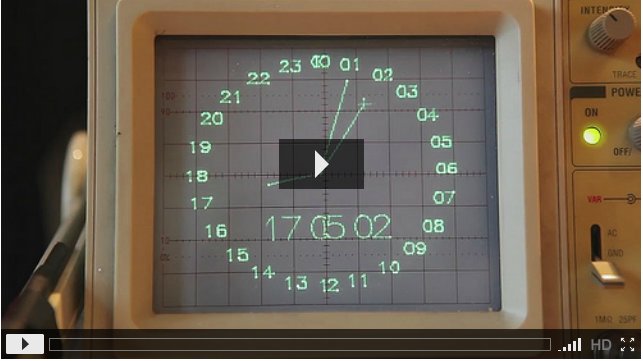
Enough with the jibber jabber -- here is a video of it in action drawing the 24-hour analog clock and an N-body simulation of the first four planets orbiting the sun.
The full source for all of the displays show here is available from: bitbucket.org/hudson/vectorscope. Have fun finding alternate uses for your oscilloscope!
Future work
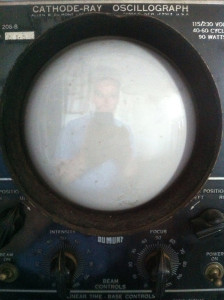
So what's next? I'd like to try resurrecting this beautiful vacuum tube "oscillograph". I want to port Spacewar! from PDP-1 assembly to the AVR. And I'd really like to design analog line drawing hardware for use as a MAME, sort of like the ZVG, but with USB instead of legacy parallel port interface. What are you going to do with your oscilloscope?
Update 2013-06-08: The oscillograph works and is now displaying Tweets and running Space Rocks, a game I wrote similar to Asteroids.
Fun projects, nicely done!
Nice retro.
You might however like to check out using SIgnetics or TI MDAC chips instead of building the r2r ladder with discrete components – more consistently repeatable, garunteed linear response (laser etched on-chip), includes latch and switches, constant impedance since 2r legs switch between ground and op-amp -ve input rail so no -i complications. Also cheaper and smaller than 1% resistors and FETs.
Another thing that is fun to do with vector graphics is to use a light pen for input – closest I ever got to touch in the ’80’s. Back then of course it was an OC71 Ge transistor with the paint scraped off, now sensors are standard fare.
Do you have the yoke for that oscillograph? Not that I still have mine – left in the UK aeons ago – but having the right one is critical.
Great post and nice displays. I’d like to build one of these. However, by using bresenham’s algorithm for drawing the lines in you are still just drawing dots and not lines on the display.
The examples you mention, the Vectrex (http://en.wikipedia.org/wiki/Vectrex), the Tektronix 4010 (http://en.wikipedia.org/wiki/Tektronix_4010) all draw lines on the display by having analog electronics draw the line between start en end with basically infinite resolution. See http://www.cca.org/vector/
The scope clock (http://www.cathodecorner.com/sc200c.html) goes one step further and uses a sine – cosine oscillator to also draw ellipses.
The SC200 is really neat — I linked to it in the diagonal line section as an example of how to do it right with analog processes, rather than the digital Bresenham algorithm.
Not true; by using Bresenham’s algorithm they’re doing a stepped approximation to a line, but it’s still a continuous figure (or at least, as continuous as you can get with limited DAC resolution and limited temporal resolution).
Isn’t that what i’m saying ? This is a very nice and simple 256 x 256 raster display, it’s just not scanning from left to right and top to bottom. It has vectors as software graphic primitives but can just as well do bitmaps and circles in software. I really like this project and would love to see it taken one step further by having the vectors drawn in analog hardware.
You’re right. I remember having a go at this years ago with, I think, an 8085 development system. You can draw the diagonal lines such as the clock hands by simply leaving the beam on while moving from the co-ords at one end directly to the co-ords at the other. I’d guess the tiny ships in ‘Spacewar’ etc were drawn this way, not as dots.
but you would be guessing wrong (as was I). The original Spacewar! game used the Type 30 display on the PDP-1 which could only output a dot at a time at an x,y location on the CRT.
Nice! Need to get my hand on one of these 🙂
Dipankar
http://www.desinerd.com
Just to show what hackers used to create vector displays back in the 70s/80s, here are two Byte articles. They are nowhere as complex as the Atari AVG/DVG-Sega G80-Cinematronics arcade games but the first is an interesting stab at the hardware.
http://malus.exotica.org.uk/~buzz/byte/pdf/BYTE%20Vol%2007-11%201982-11%20Graphics.pdf (p508)
http://malus.exotica.org.uk/~buzz/byte/pdf/BYTE%20Vol%2000-15%201976-11%20More%20Fun%20than%20Crayons.pdf (p78)
If you REALLY want to go all out on vector display hardware, this paper (written by an Atari engineer) is the last word. http://www.jmargolin.com/vgens/vgens.htm
If you had at least one more bit on another port, and a scope with z-axis/intensity, you could control the beam intensity better by varying the voltage on the z-axis.
In 1972 we used a pen plotter and this could take an hour or more for some plots – i rigged up somehting like this using a storage ‘scope which enabled the researchers to preview their plots in a minute or less before committing to paper
Nice. Nice Nice… I like it.
Does anyone know if I can do the same using a digital Osciloscope?
Greetings.